| basic | limited | unimproved | open defecation | |
|---|---|---|---|---|
| Central and Southern Asia | 79% | 17% | 3% | 1% |
| Eastern and South-Eastern Asia | 95% | 3% | 2% | 1% |
| Europe and Northern America | 99% | 1% | 1% | 0% |
| Latin America and the Caribbean | 93% | 4% | 3% | 0% |
| Northern Africa and Western Asia | 95% | 2% | 2% | 0% |
| Oceania | 71% | 9% | 17% | 3% |
| Sub-Saharan Africa | 46% | 32% | 17% | 5% |
| Fragile or Extremely Fragile | 62% | 22% | 13% | 3% |
| Least Developed Countries | 48% | 29% | 20% | 4% |
| Landlocked Developing Countries | 62% | 22% | 14% | 2% |
| Small Island Developing States | 83% | 10% | 5% | 2% |
| World | 88% | 8% | 3% | 1% |
Week 6
Quarto for Data Communication
Income
Figure 1 is a box- and jitterplot of countries with percentages of populations with access to basic sanitation in 2020 grouped by income classifications.
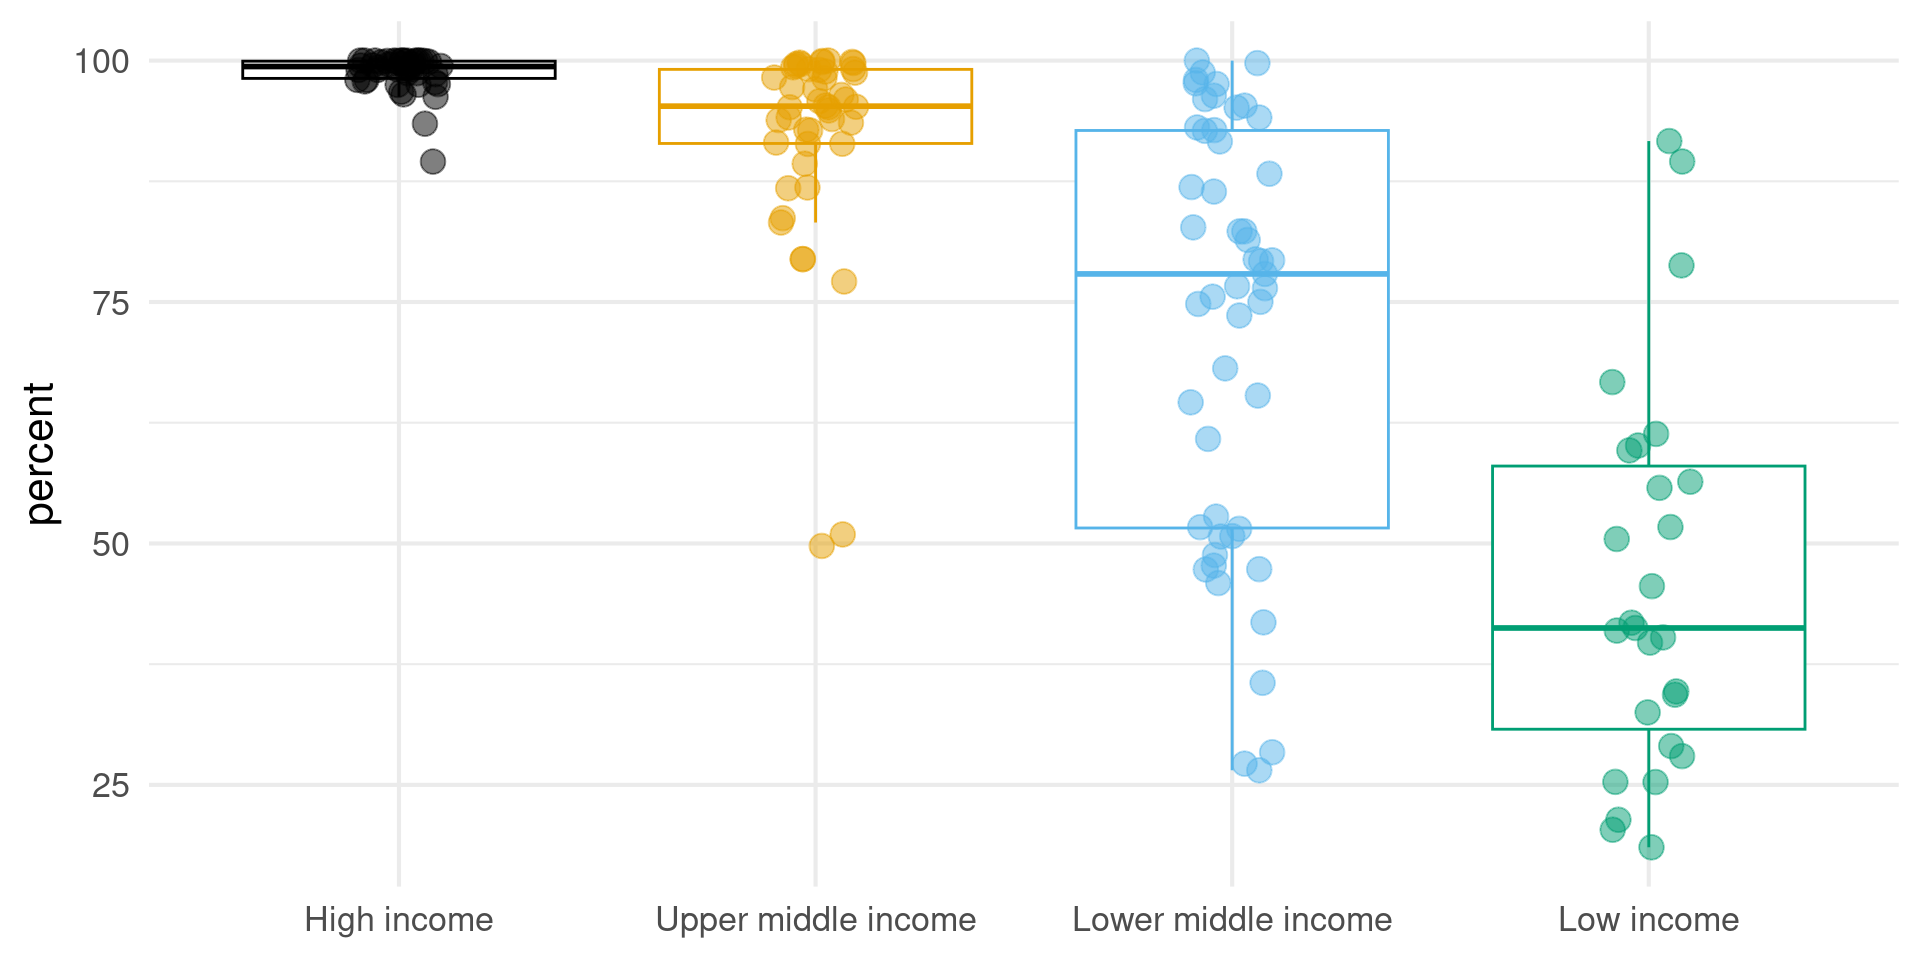
Figure 1: Access to sanitation (urban) in 2020 by income classifications.
Uganda
Figure 2 below shows the sanitation ladder for Uganda.
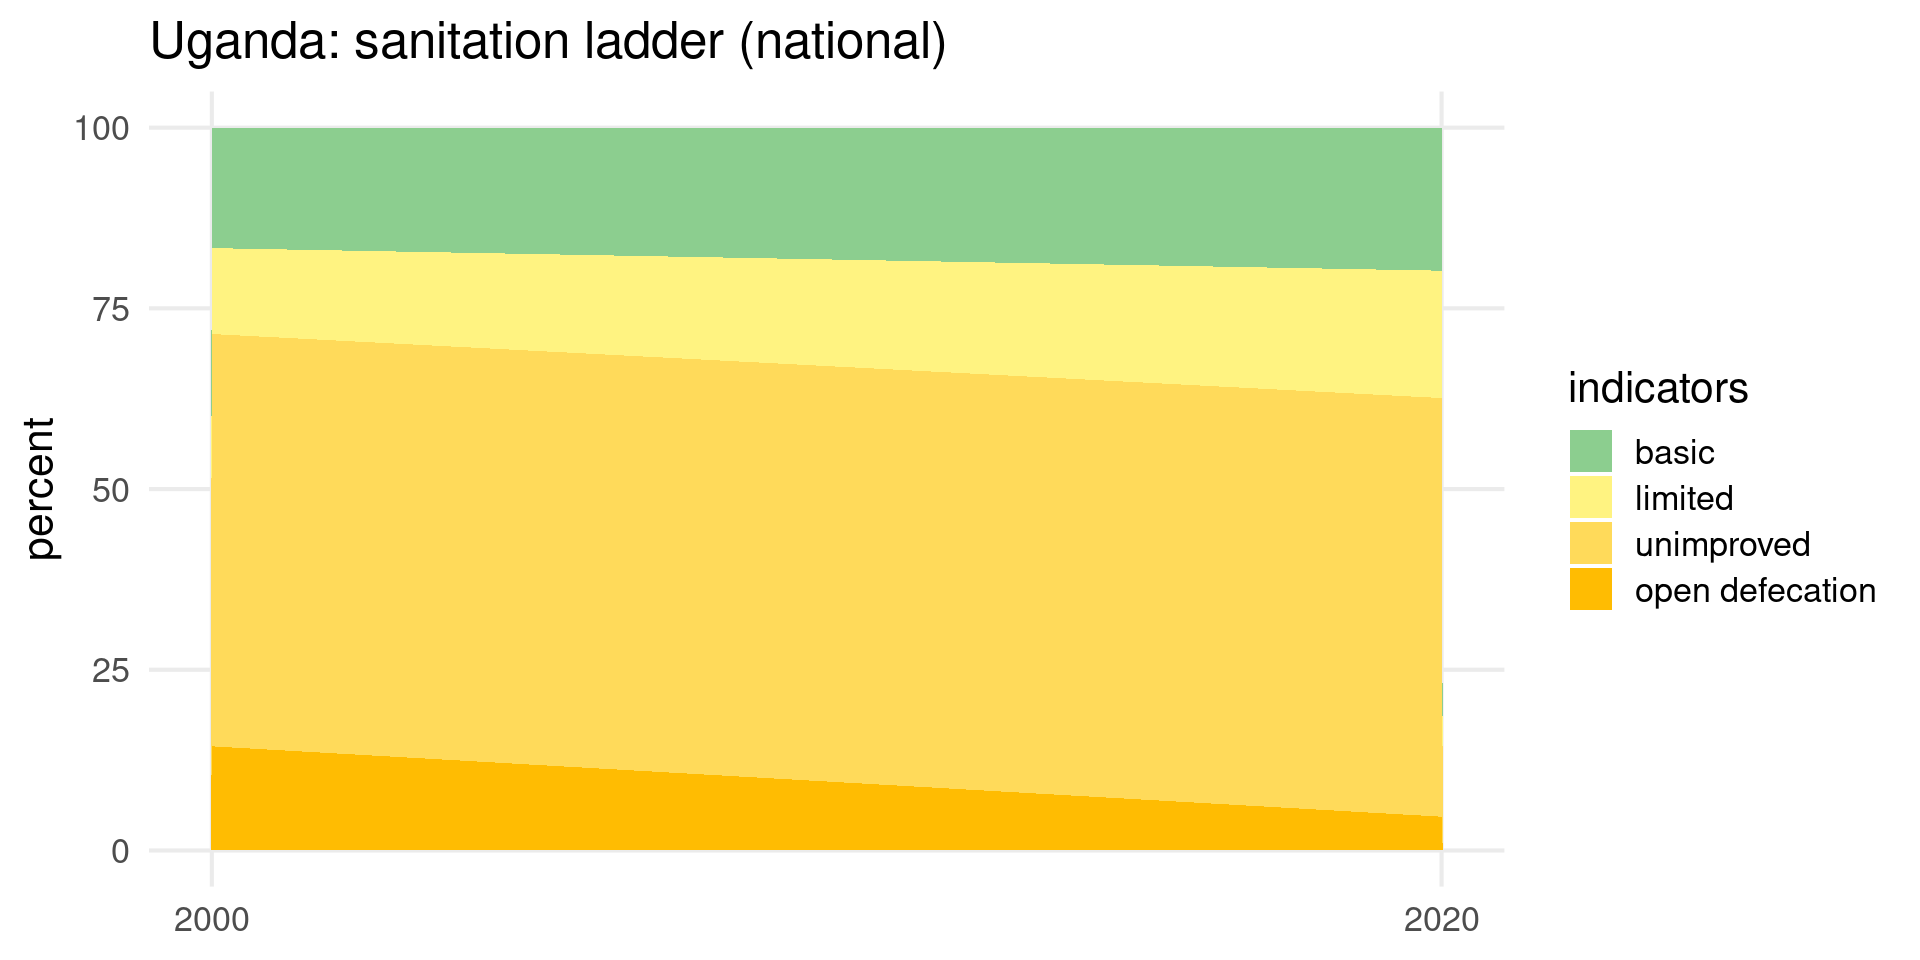
Figure 2: Sanitation indicators for Uganda on a national level.